-
Latency distribution of N parallel tasks
A common thing in any system is running a bunch of similar tasks. For example, to serve a request we need to read a number of enries from a database (so the “task” in this case is a database read). We typically have an idea how latency for a single task looks like. Being good engineers and caring about observability we likely measure average latency $ T_{avg} $ and things like p95/p99 quantiles and standard deviation $\sigma$ (maybe we even have opentracing instrumentation to measure those with).
Read more… -
vPMU support on EC2 and the weird case of z1d instance family
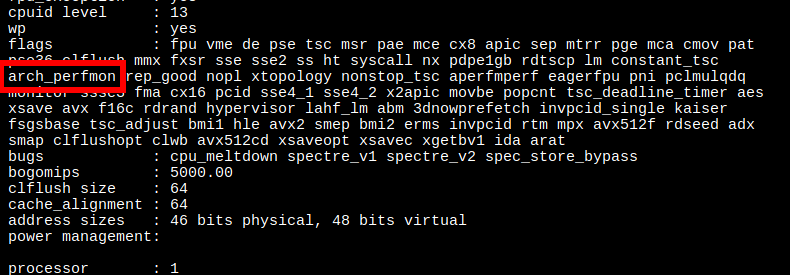
As explained in great detail in this post by Brendan Gregg Performance Monitoring Counters are an awesome way to measure performance on modern processors. You can get insight into things like branch mispredictions, cache misses and TLB performance. You can also do sampling based on these events in
Read more…perf(aka Precise Event Based Sampling/PEBS). -
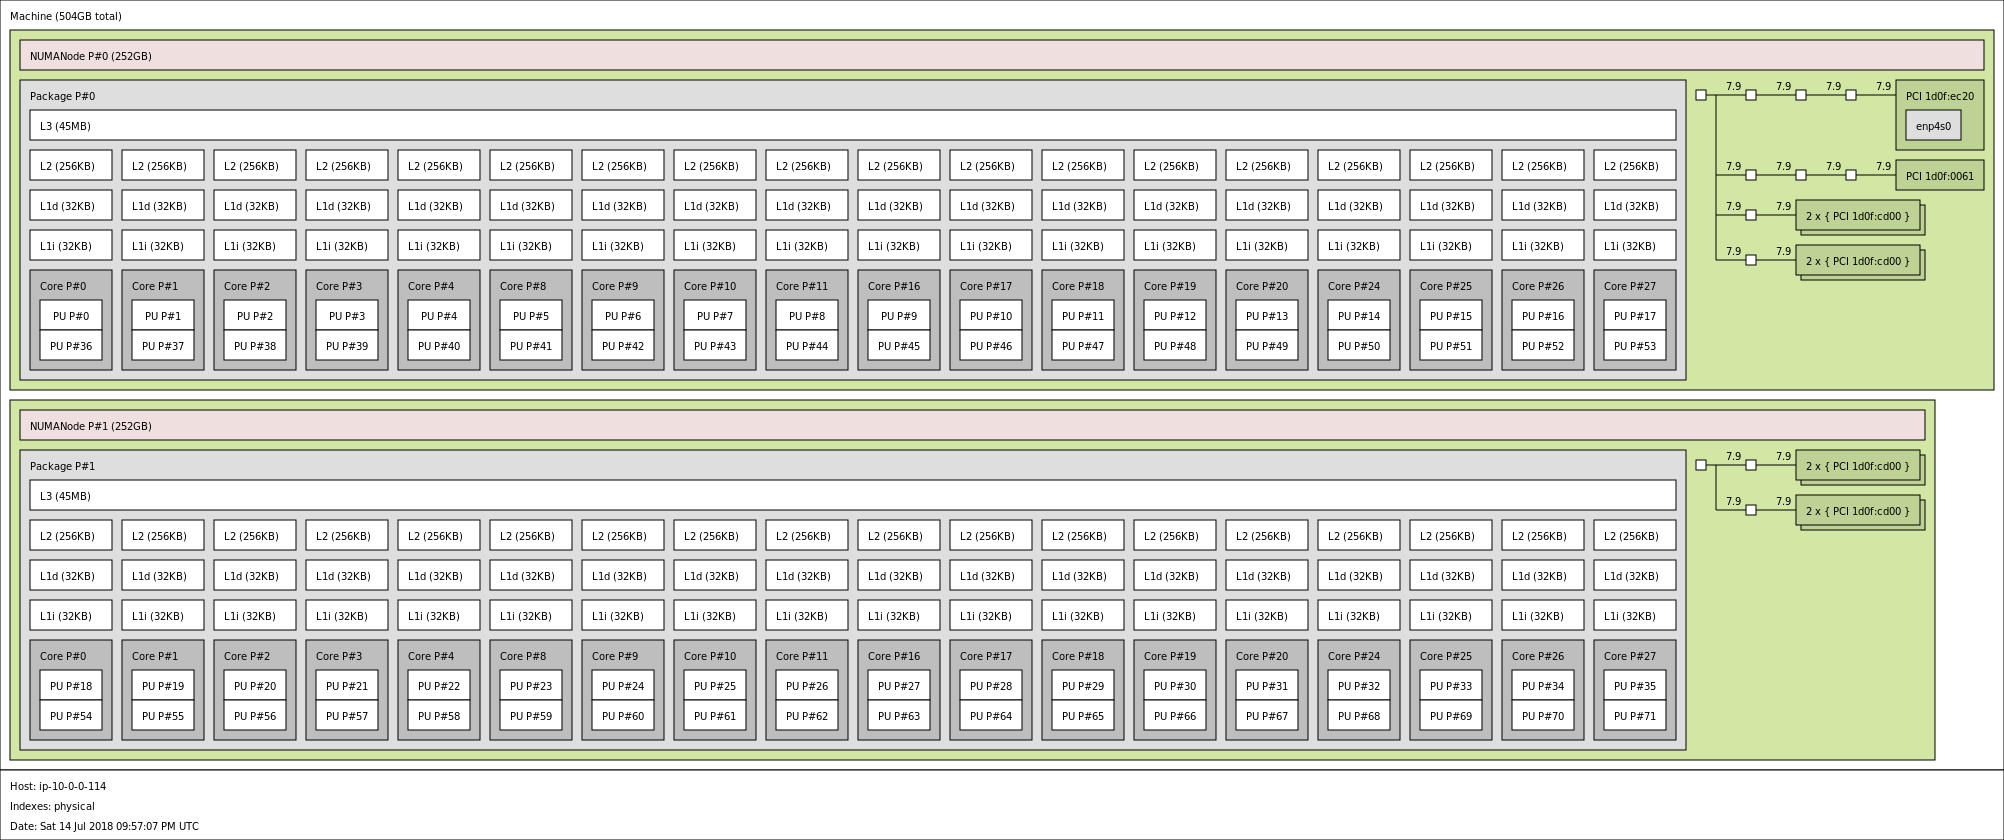
/proc/cpuinfo and CPU topology for all 113 AWS instance types
I grew tired of having to launch an instance to check a few CPU flags. So I figured, I'll just do it once and for all.
Read more…

