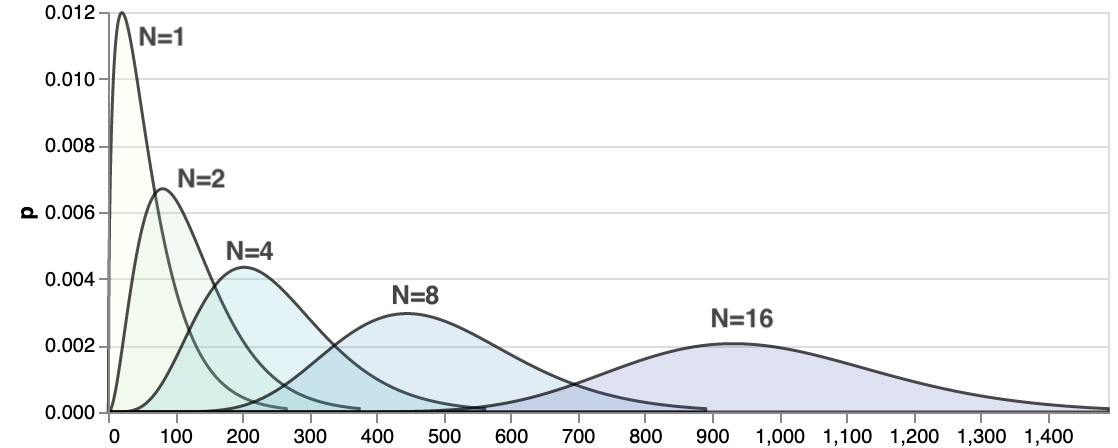
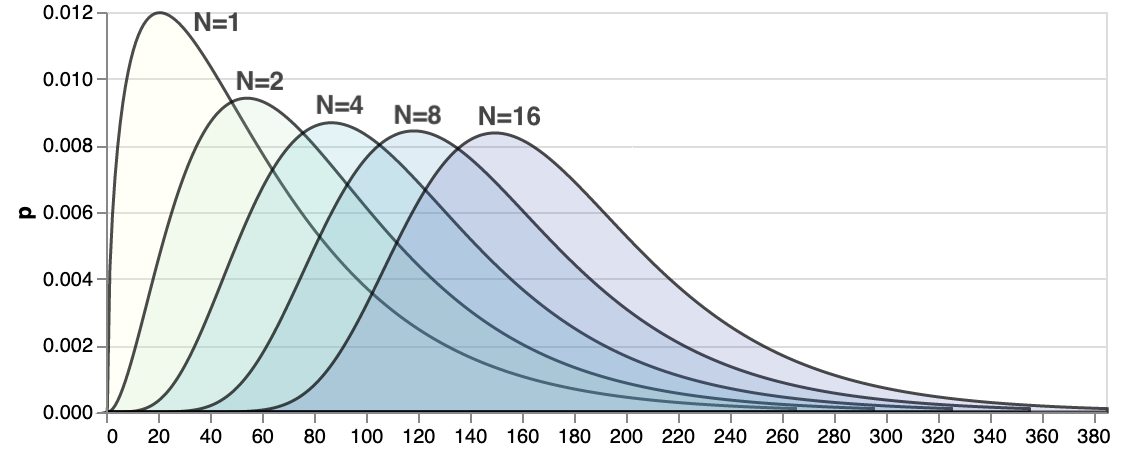
Latency distribution of N parallel tasks
A common thing in any system is running a bunch of similar tasks. For example, to serve a request we need to read a number of enries from a database (so the “task” in this case is a database read).
We typically have an idea how latency for a single task looks like. Being good engineers and caring about observability we likely measure average latency $ T_{avg} $ and things like p95/p99 quantiles and standard deviation $\sigma$ (maybe we even have opentracing instrumentation to measure those with).
But what would be overall latency of a request involving multiple identical tasks would look like?
Here's the calculator I've made that allows you to see the distribution given p95 and mininum latency of a single task. If you're looking for some rules of a thumb, read on.
Sequential tasks
If we run N identical tasks sequentially, it is not hard to imagine what will happen to the overall response latency if you remember the central limit theorem.
Regardless of what the latency distribution of one task is, overall latency will tend towards normal distribution for a large enough $N$. Average total latency for $N$ tasks executed sequentially will be close to $ T_{avg} \cdot N$ with the standard deviation of $\sigma\sqrt N$. So for quantile back-of-the-napkin math, we can use usual z-score tables for normal distribution, for example p95 will be around $1.65\cdot\sigma\sqrt N $.
Though it is still interesting to know what it'd be for small values of $N$, as it is likely that we'll encounter them in practice.
Parallel tasks
If these tasks don't depend on each other, we may run them all in parallel. Issue those database read requests simultaneously, wait for all of them to complete and return the results to the user.
The changes in latency distribution are a little less intuitive. It makes sense that'd be worse than the individual task. As we run a bunch of them, with larger $N$ there is an increasing chance that at least one of them will get unlucky and will take longer. And we have to wait for all of them before returning the response, so things will get worse, but how much worse?
Here's how it looks like if the single task latency follows chi-squared distribution:
Chi-squared is not the only choice, picked here simply because it is asymmetric, long-tailed and looks like some latency distributions I've measured in the wild. Above picture may look quite different for a different distribution.
So we want to figure out if there is an easy way to compute quantiles for the entire request with $N$ tasks running in parallel under the hood. Ideally, without making too many assumptions about the shape of the underlying single-task distribution.
Of course this doesn't sound like a particularly exotic problem. If you look at the wikipedia page on order statistics, someone did the math for us and there is a simple formula for the CDF of a maximum of $N$ iid random variables given a CDF of a single variable $F_X$: $$ F_{X_{(n)}} = \max\{X_1,…,X_n\} = [F_X(x)]^n $$
To find 95% quantile, since quantile function is the inverse of the CDF on the left, it would be $F_X^{-1}(0.95^{1/N})$, where $F_X^{-1}$ is the inverse CDF aka quantile function of the latency distribution of a single task. Or in other words:
The $p$-th latency percentile for $N$ tasks running in parallel is equal to $p^{1/N}$-th latency percentile of a single task.
For example, if we want to compute p95 of 5 tasks, $0.95^{1/5} \approx 0.99$ so we just need to look up p99 value from the latency distribution of our single task, and that'd be p95 of five.

